commodity

Aluminium

The most used non-ferrous metal, made from bauxite via alumina. Its carbon footprint depends mostly on the power used to smelt it.

Figures checked Next check Feb 2027, after USGS Mineral Commodity Summaries 2027

Key figures

Each figure shows where it comes from and which year it describes.

~74 Mt

of primary aluminium was smelted in 2025.

USGS Mineral Commodity Summaries 2026 · 2025 estimate

61%

of primary aluminium was smelted in China, about 45 Mt.

USGS Mineral Commodity Summaries 2026, our calculation · 2025 estimate

~440 Mt

of bauxite was mined in 2025.

USGS Mineral Commodity Summaries 2026 · 2025 estimate

34%

of bauxite came from Guinea, about 150 Mt.

USGS Mineral Commodity Summaries 2026, our calculation · 2025 estimate

Supply chain explainer

Interactive · 6 stages

Mined at 25%. Refined at 53%. Smelted to 99.7%.

Six stages from bauxite to cars, cans and buildings, with aluminium content and the record that moves at each handover.
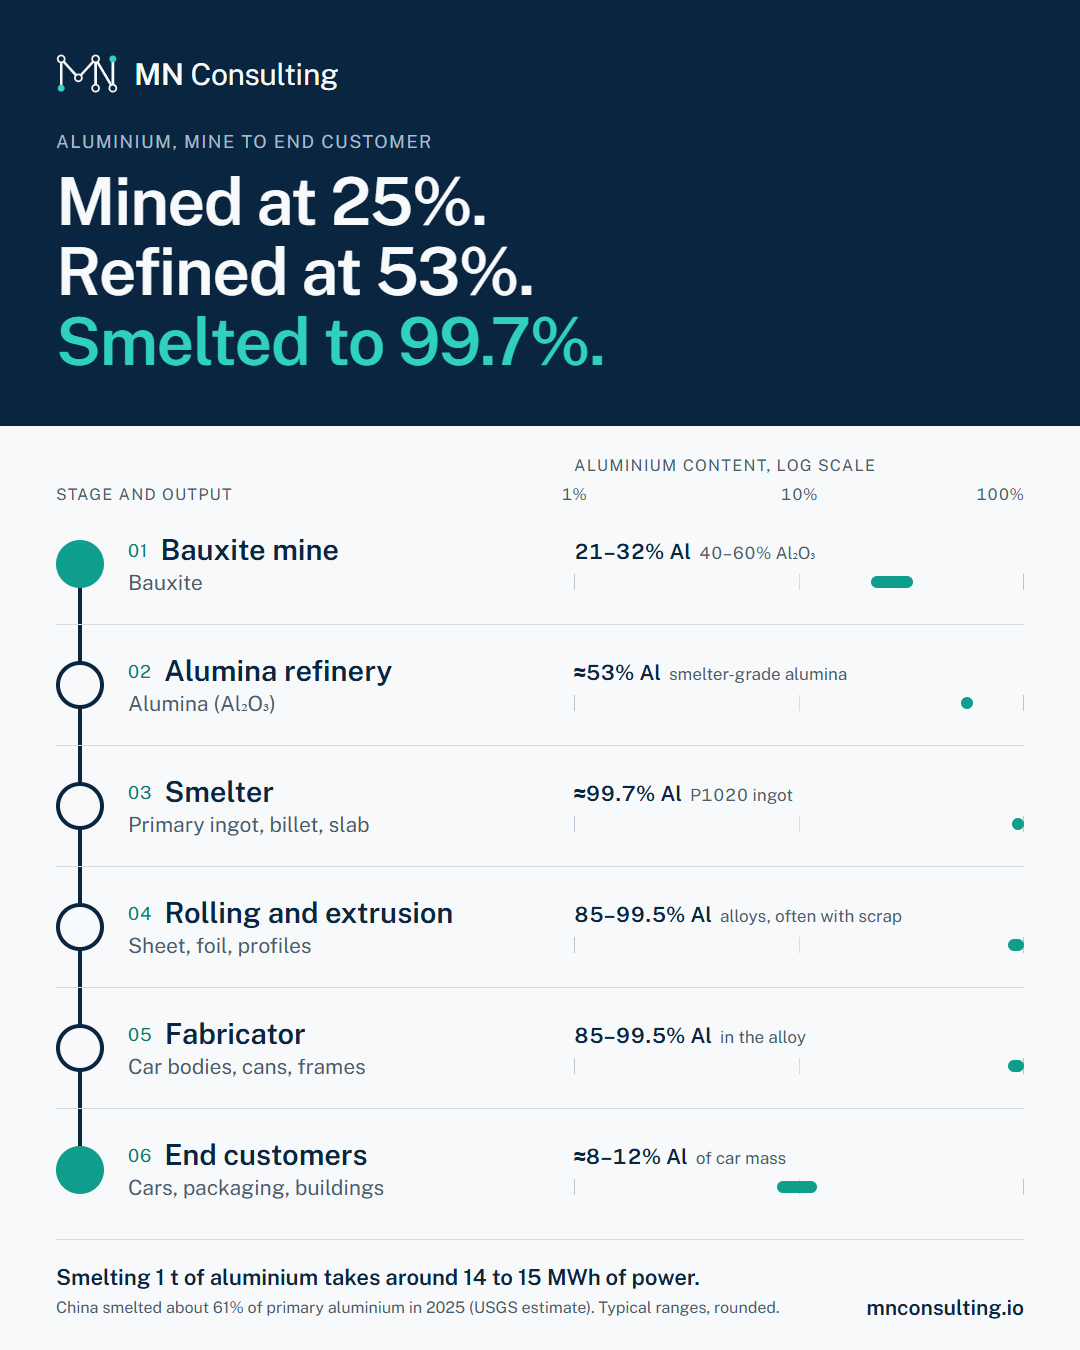
  1. Bauxite mine21–32%
  2. Alumina refinery≈53%
  3. Smelter≈99.7%
  4. Rolling and extrusion85–99.5%
  5. Fabricator85–99.5%
  6. End customers≈8–12%

Update log

What changed on this page, and when.

  1. Scheduled

    Check production figures against USGS Mineral Commodity Summaries 2027.

  2. Published

    Page published with the supply chain explainer and key figures from USGS Mineral Commodity Summaries 2026.

Related

  • Guide · PDF by emailPilot to scale-up

    Why traceability rollouts stall after the pilot, the data blueprint, the first 90 days and a go-live checklist.

  • One-pager · ImageTraceability rollout in one page

    Sixteen steps from naming the scale-up budget holder to showing momentum in the first 90 days, on a single page.