explainer · silver
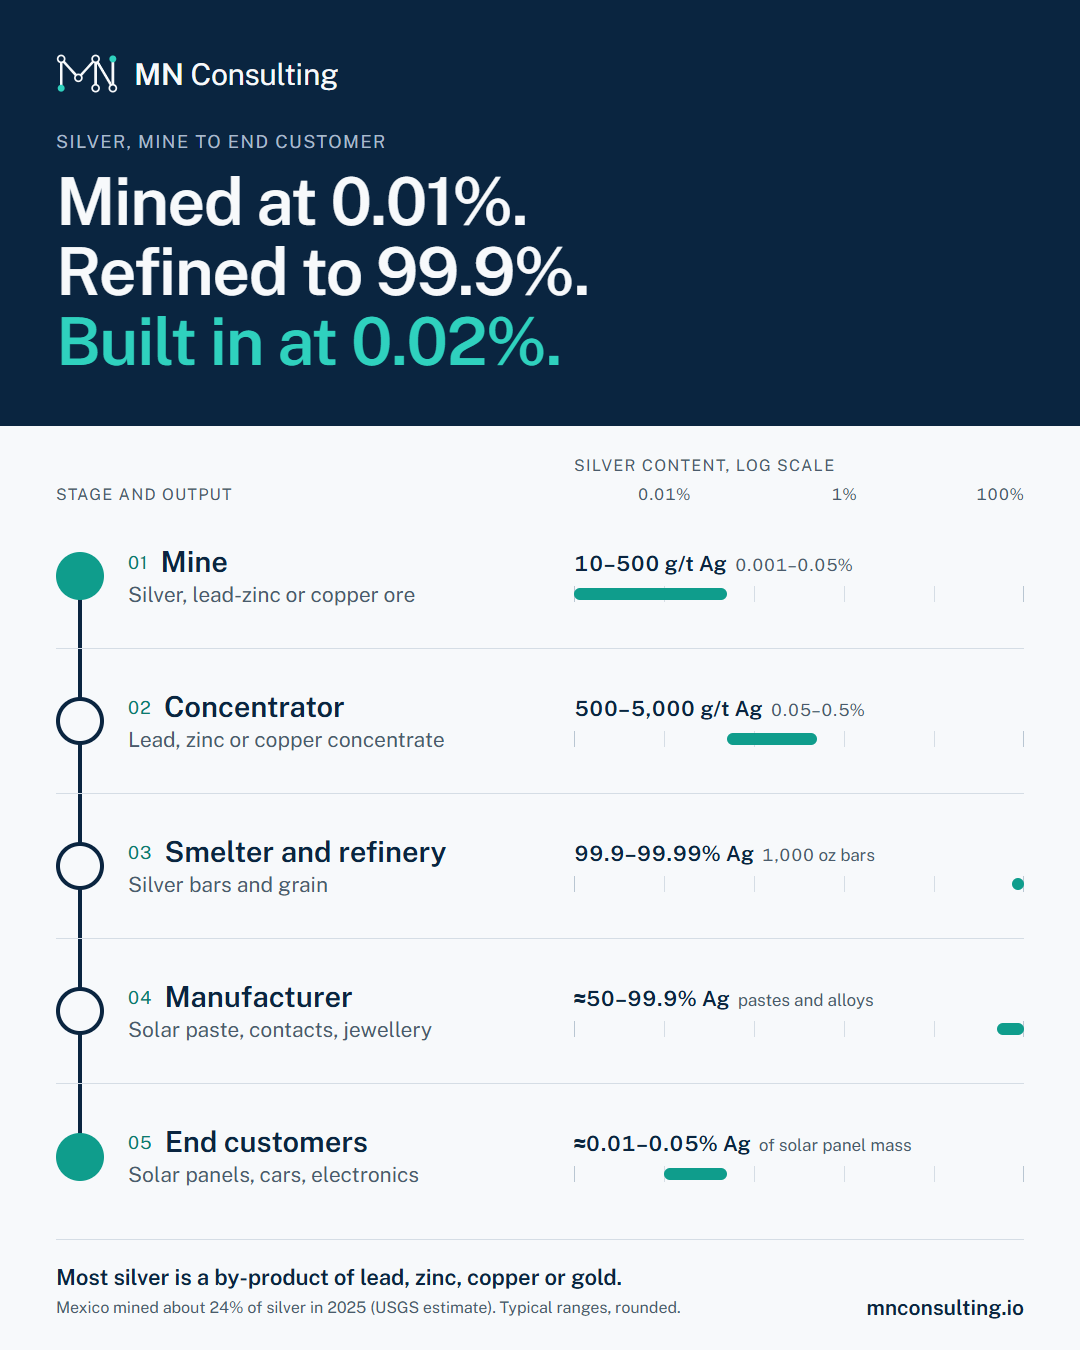
Mined at 0.01%. Refined to 99.9%. Built in at 0.02%.
Most silver rides along with lead, zinc, copper or gold. It is recovered at the smelter, refined to 99.9%, and spread thinly through solar panels and electronics.
5 stages
Five stages, from mine to solar panel
Select a stage to see what happens there, who does it, and which record moves with the material. The bars show silver content by mass on a log scale.
Silver content is shown by mass. 100 g/t is 0.01%.
scale
Where silver comes from
of silver was mined in 2025. USGS Mineral Commodity Summaries 2026, 2025 estimate
of mined silver came from Mexico, about 6,300 t. Peru and China came next. USGS Mineral Commodity Summaries 2026, our calculation, 2025 estimate
of silver was consumed, more than was mined. Recycling and stocks cover the gap. USGS Mineral Commodity Summaries 2026, 2025 estimate
average silver price in 2025, up 34% on 2024. USGS Mineral Commodity Summaries 2026, 2025 estimate
traceability
Where the record usually breaks
- At the smelterSilver comes in with lead, zinc and copper concentrates from many mines. It is recovered from shared residues, so its mine of origin is rarely kept.
- At the refineryRefiners pool mined and recycled silver. Bars name the refiner, not the mine.
- At the end customerSolar and electronics buyers rarely see silver on a bill of materials, so origin questions stop at the paste or component supplier.
Our traceability rollouts link these records, from mine lot to finished product, so a claim about origin holds up when a customer or regulator asks for it.
Planning a traceability rollout, or one that has stalled after the pilot? Book a 30-minute call.
share
The whole chain on one image
A 1080 × 1350 image of the 5 stages, sized for LinkedIn. Free to share with a link back to this page.
Sources
Production figures are USGS estimates for 2025. Stage ranges are typical industry values, rounded, not data for a specific plant.