explainer · rare earths
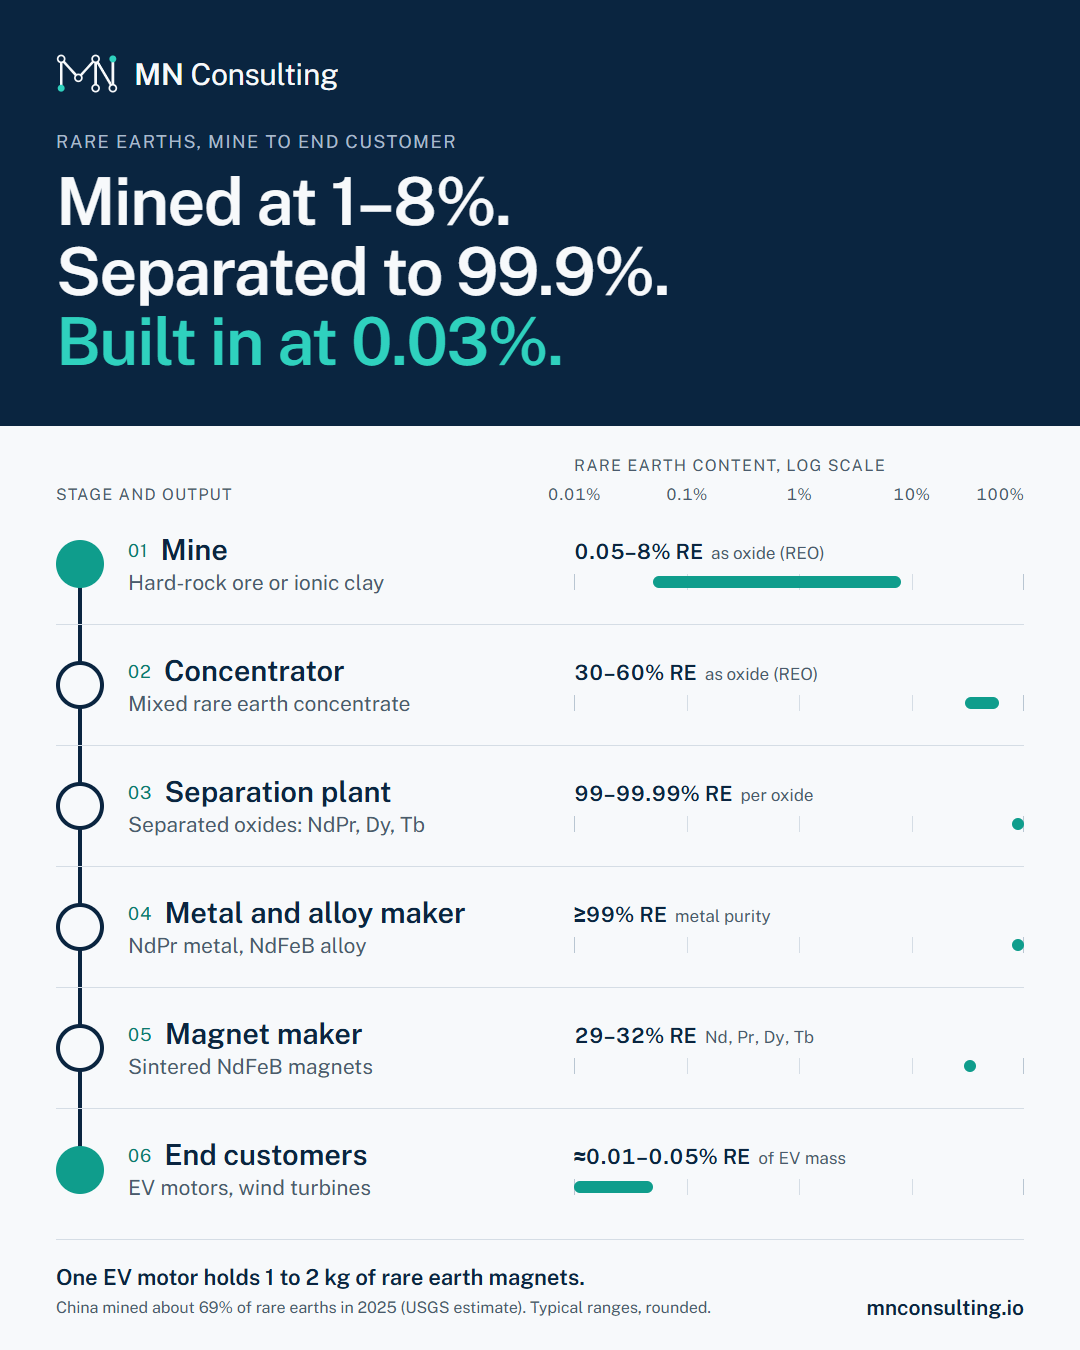
Mined at 1–8%. Separated to 99.9%. Built in at 0.03%.
Rare earths are mined together, separated element by element in long chemical circuits, then made into the magnets that drive EV motors and wind turbines. Separation and magnet making are concentrated in China.
6 stages
Six stages, from mine to motor
Select a stage to see what happens there, who does it, and which record moves with the material. The bars show rare earth content by mass on a log scale.
Mine and concentrate grades are shown as rare earth oxide (REO). Later stages show rare earth metal content by mass.
watch
Rare earth recycling: old magnets, new motors
The chain above starts at the mine. This walkthrough follows the recycling route instead, from end-of-life motors back to new magnets.
scale
Where rare earths come from
of rare earth oxide was mined in 2025. USGS Mineral Commodity Summaries 2026, 2025 estimate
of mined rare earths came from China, about 270,000 t. USGS Mineral Commodity Summaries 2026, our calculation, 2025 estimate
came from the US, about 51,000 t, mostly from Mountain Pass. USGS Mineral Commodity Summaries 2026, our calculation, 2025 estimate
rare earth elements were added to China's export controls in April 2025. USGS Mineral Commodity Summaries 2026, 2025
traceability
Where the record usually breaks
- At the separation plantConcentrates from several mines and countries go through the same circuit, so each oxide batch carries mixed origin.
- At the magnet makerMagnets combine neodymium, praseodymium and heavy rare earths from different oxide batches and suppliers.
- At the end customerExport licences and new buyer rules ask where magnets and their rare earths came from. Few suppliers can answer below the magnet.
Our traceability rollouts link these records, from mine lot to finished product, so a claim about origin holds up when a customer or regulator asks for it.
Planning a traceability rollout, or one that has stalled after the pilot? Book a 30-minute call.
share
The whole chain on one image
A 1080 × 1350 image of the 6 stages, sized for LinkedIn. Free to share with a link back to this page.
Sources
Production figures are USGS estimates for 2025. Stage ranges are typical industry values, rounded, not data for a specific plant.