explainer · lithium
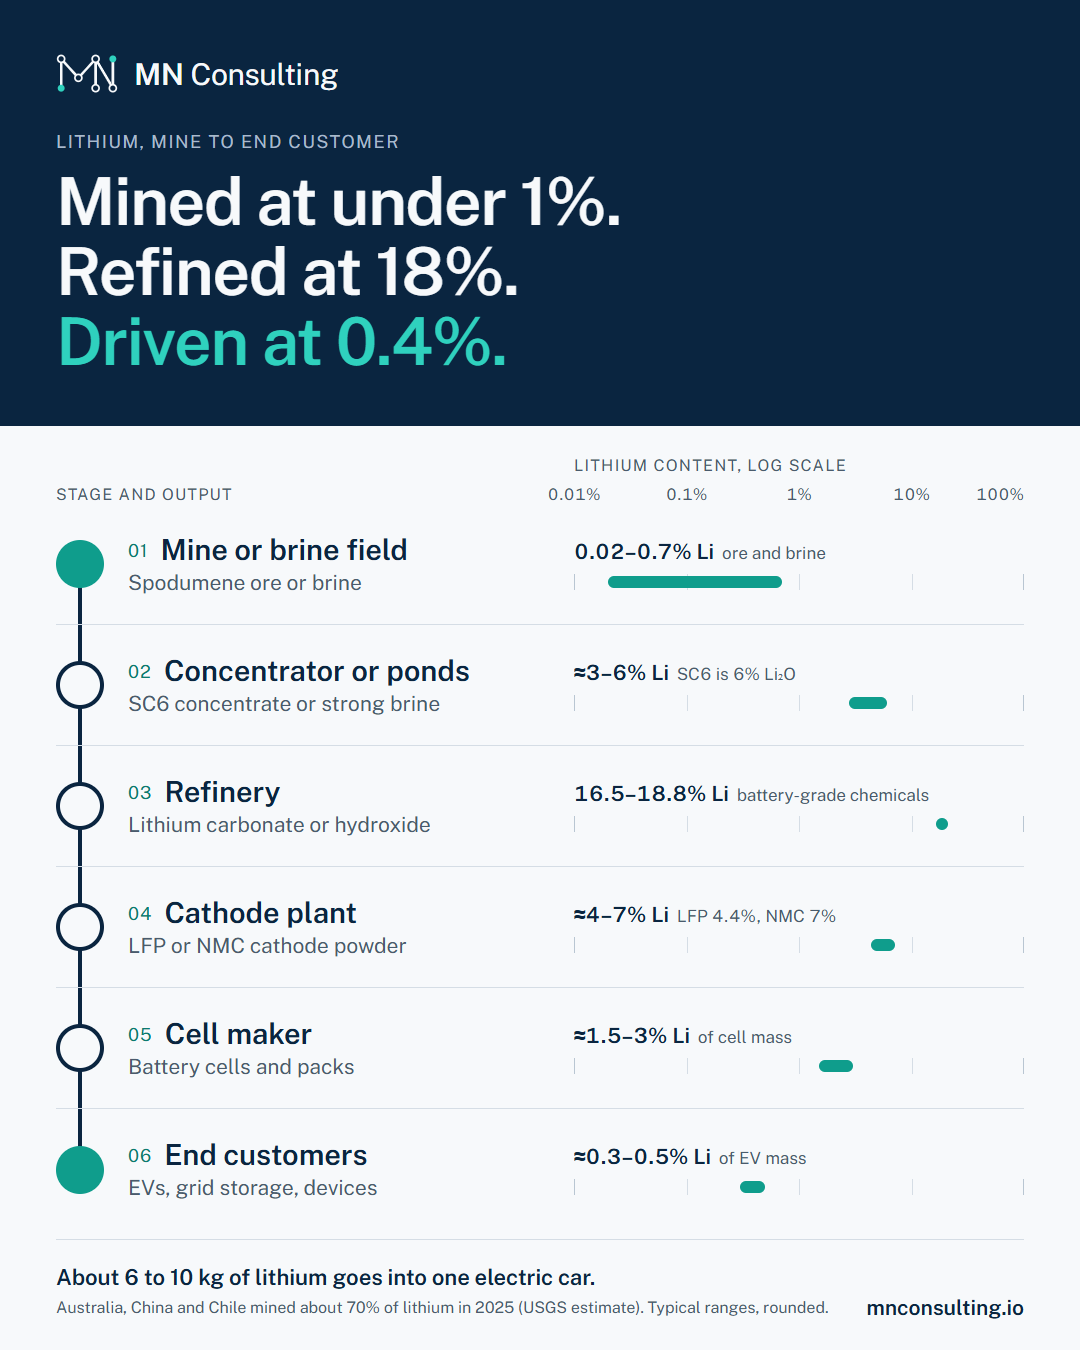
Mined at under 1%. Refined at 18%. Driven at 0.4%.
Lithium starts as rock or brine at well under 1%, is refined into chemicals at 16 to 19%, and ends up spread through a battery pack. Most of the world’s refining happens in one country, far from the mines.
6 stages
Six stages, from mine or salt flat to electric car
Select a stage to see what happens there, who does it, and which record moves with the material. The bars show lithium content by mass on a log scale.
Lithium content is shown as elemental lithium (Li) by mass. Ore grades are often quoted as Li₂O: 1% Li₂O is about 0.46% Li.
scale
Where lithium comes from
of lithium was mined in 2025, excluding the US, up 31% on 2024. USGS Mineral Commodity Summaries 2026, 2025 estimate
of mined lithium came from Australia. China mined 21% and Chile 19%. USGS Mineral Commodity Summaries 2026, our calculation, 2025 estimate
growth in world lithium consumption in 2025, to about 263,000 t. USGS Mineral Commodity Summaries 2026, 2025 estimate
is when the EU battery passport becomes mandatory for EV and industrial batteries. EU Battery Regulation 2023/1542, in force
traceability
Where the record usually breaks
- At the refineryConverters blend concentrate and brine from several sources into one batch of carbonate or hydroxide. Unless mass balance or segregation is recorded, the mine of origin stops here.
- At the cathode plantOne cathode lot draws on lithium, nickel and cobalt batches from different refiners, and each has its own records.
- At the end customerThe EU battery passport asks for supply chain due diligence and recycled content per battery. Without lot links upstream, the passport falls back on averages.
Our traceability rollouts link these records, from mine lot to finished product, so a claim about origin holds up when a customer or regulator asks for it.
Planning a traceability rollout, or one that has stalled after the pilot? Book a 30-minute call.
share
The whole chain on one image
A 1080 × 1350 image of the 6 stages, sized for LinkedIn. Free to share with a link back to this page.
Sources
Production figures are USGS estimates for 2025. Stage ranges are typical industry values, rounded, not data for a specific plant.