explainer · iron ore
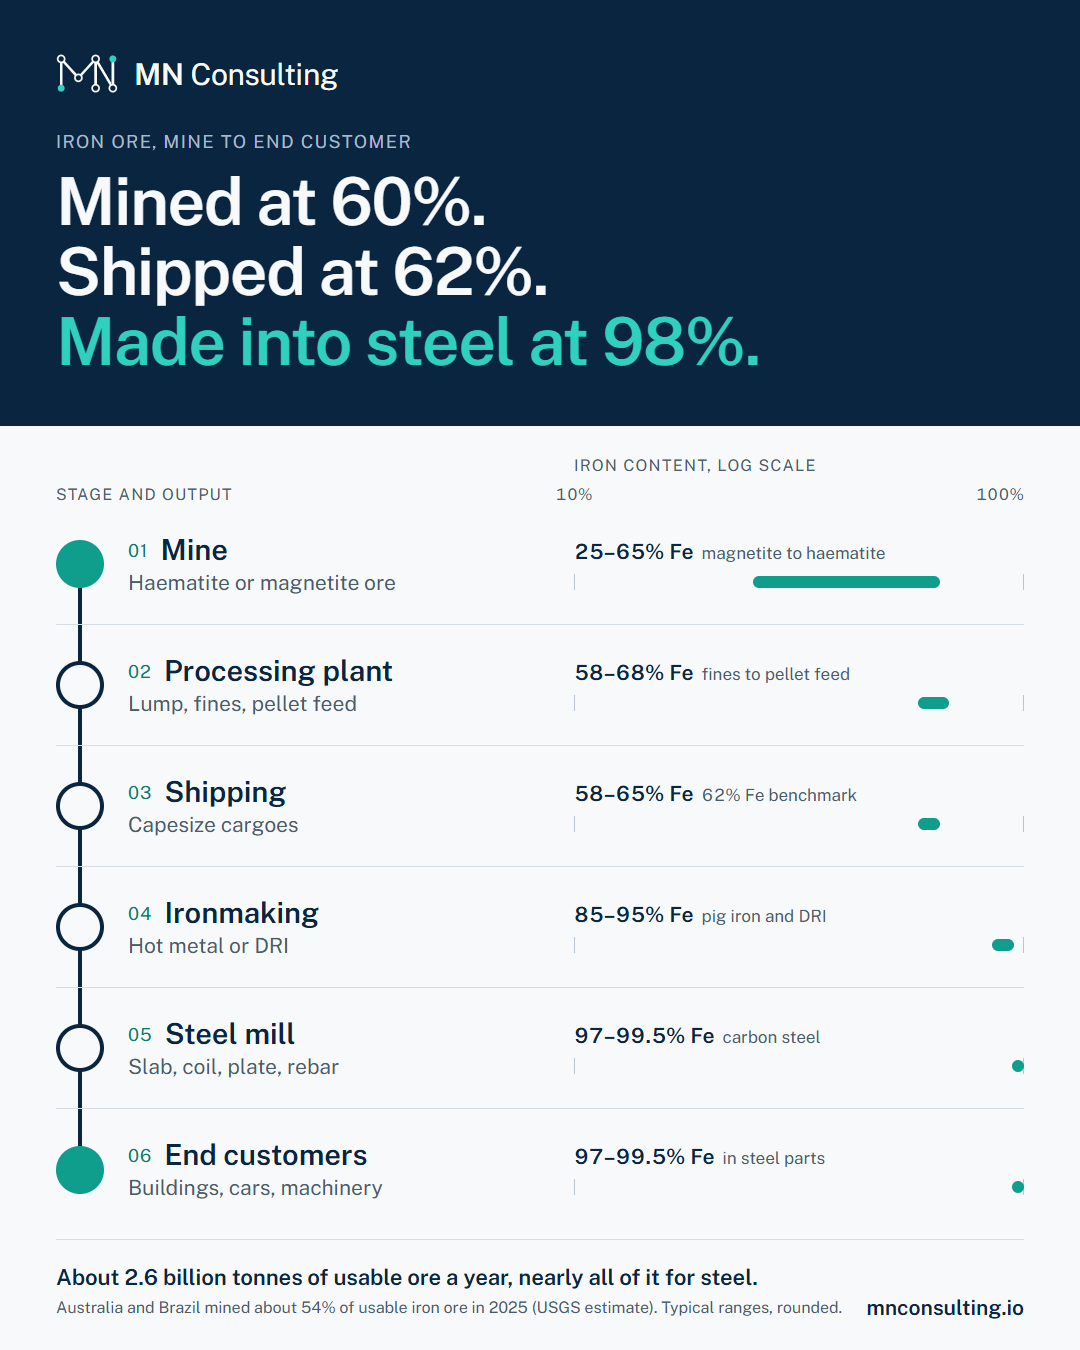
Mined at 60%. Shipped at 62%. Made into steel at 98%.
Iron ore is mined at high grades by mining standards and shipped in huge volumes. Its content barely changes until the blast furnace, but its origin is lost early, in blends designed to hit a product specification.
6 stages
Six stages, from mine to steel product
Select a stage to see what happens there, who does it, and which record moves with the material. The bars show iron content by mass on a log scale.
Iron content is shown as elemental iron (Fe) by mass. The scale runs from 10% to 100%.
scale
Where iron ore comes from
of usable iron ore was mined in 2025. USGS Mineral Commodity Summaries 2026, 2025 estimate
of usable ore came from Australia, about 980 Mt. USGS Mineral Commodity Summaries 2026, our calculation, 2025 estimate
came from Brazil, about 420 Mt. USGS Mineral Commodity Summaries 2026, our calculation, 2025 estimate
average price of 62% Fe fines delivered to Tianjin, January to September 2025. USGS Mineral Commodity Summaries 2026, Jan–Sep 2025
traceability
Where the record usually breaks
- At the mineOre from several pits is blended into a named product to keep the grade stable, so a cargo rarely maps to one pit.
- At the steel mill portCargoes from different miners share port stockpiles and the blast furnace burden changes daily.
- At the end customerBuyers increasingly want emissions per tonne of steel. That figure depends on the ore and route behind each heat.
Our traceability rollouts link these records, from mine lot to finished product, so a claim about origin holds up when a customer or regulator asks for it.
Planning a traceability rollout, or one that has stalled after the pilot? Book a 30-minute call.
share
The whole chain on one image
A 1080 × 1350 image of the 6 stages, sized for LinkedIn. Free to share with a link back to this page.
Sources
Production figures are USGS estimates for 2025. Stage ranges are typical industry values, rounded, not data for a specific plant.